6 Surprising Facts About Rents in California: Data and Analysis
One crucial factor that influences inflation is the rent — this fundamental aspect of the economy measures the one thing that affects us all, even if you are not the one paying the rent. At the start of this year, the markets rallied with a burst of optimism on the news that the Fed was taking a more “dovish” 🕊️ stance. This was reportedly due to the perception of slowing economic conditions, which was seen as a good signal by many 🤔.
This is a follow-up to my last article about the housing market where I wrote about houses’ prices across the US and how they seemed to be coming down from their peaks in mid-last year. I think the next logical piece of the puzzle in the housing and real estate market is the rents. Like with many assets, the owners or people in general might be interested in knowing the yield factor associated with these assets, but more so what does rents tell about the dreaded inflation. So, the data comes again from the same source, Zillow, the real estate marketplace that also provides aggregated data on home prices and rents from listings on their platform. Besides the ZHVI that we used last time, Zillow also publishes ZORI (Zillow Observed Rent Index), an estimate of the median rent for a given geographic area, based on a combination of Zillow rental data and other sources.
You may be wondering why I only focus on California. First, this is my neck of the woods. But more generally, I am trying to tackle this analysis by pieces, and California has the biggest economy of all the states and has been affected by the post covid exodus and other economic factors. So, I’ll start here, and maybe do Texas and New York later, or you can let me know in the comments if you are interested in seeing this for your state, and I’ll get working on it for the next piece.
So, without further ado, here are the six highlights from Zillow’s ZORI analysis:
1. Malibu is still the most expensive city to rent in California
Alright, maybe not so surprising, but hear me out. According to ZORI, the city of Malibu had an average rent of $11.5K in the month of January 2023.
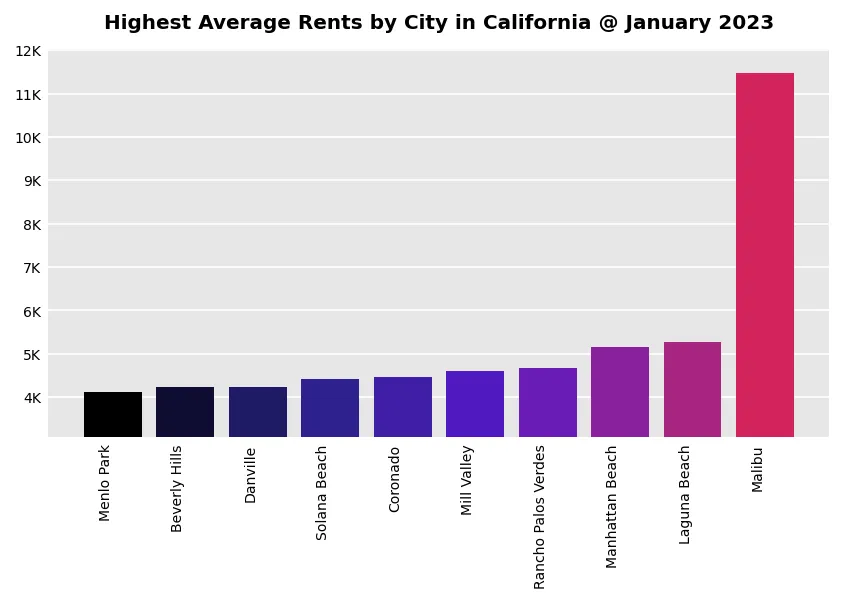 Highest Average Rents by City in California at January 2023
That’s pretty insane. When comparing it with its closest competitor, Laguna Beach. There you can find an average rent of $5.3K, which is less than half as much as Malibu (and maybe nicer?). But somehow, Malibu has consistently held that top position, three years ago the average rent was $7.6K, also the highest. I am also surprised that Mill Valley in Marin County came in fourth on the list with $4.6K. Here’s the table for more detail:
 Highest Average Rents by City DataFrame
2. Ridgecrest is the cheapest city to rent in California
Not sure if you have ever heard of Ridgecrest along U.S. Route 395 in the Indian Wells Valley in northeastern Kern County, adjacent to the Naval Air Weapons Station China Lake. Yeah, me neither. Well, it was incorporated as a city in 1963. According to this dataset, in 2023 you can find a rental for $1.34K, maybe even less since these are average values. And this is after a 22% increase over the last three years! See, you don’t need to go to Idaho to find these prices.
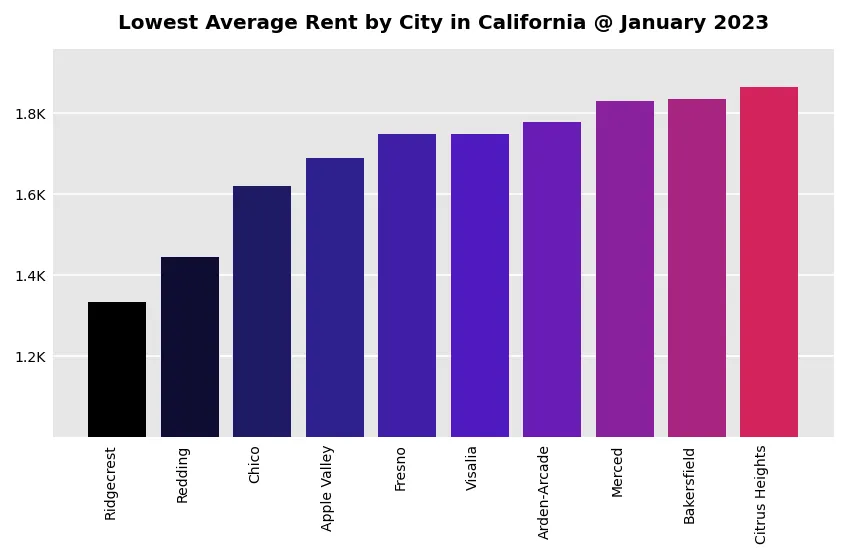 Lowest Average Rent by City in California as of January 2023
 Lowest Average Rent by City in California as of January 2023
3. Los Angeles County has the widest range of rents
Here, you can find the cheapest and most expensive cities to rent in the same county. Best way of getting a sense of this is with a Boxplot. These are cool because they show everything: the range, median, quartiles, and any outliers in a compact and easy-to-read format. They are super useful for statistical inferences, that is, to compare distributions and to detect potential differences between groups or categories. It’s pretty compact, so give it a click to see the enlarged version.
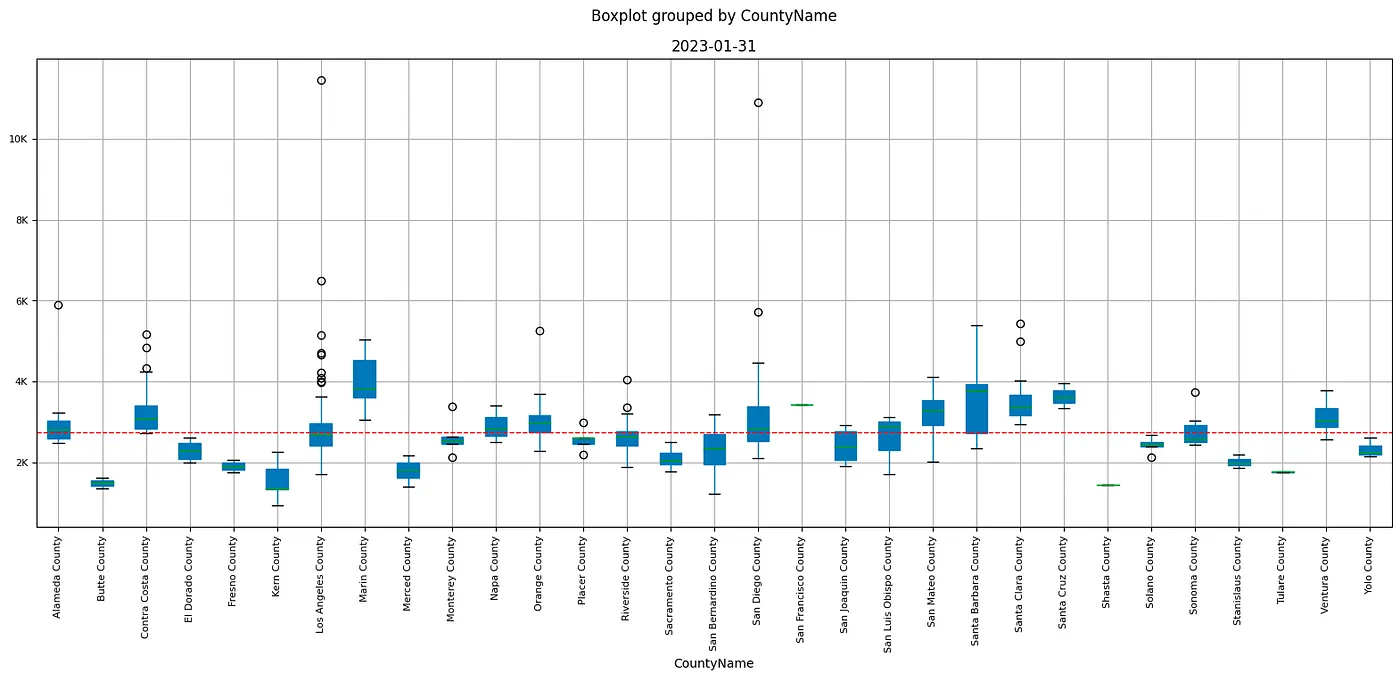 Rent distribution by County in California as of January 2023
I included the mean line for these counties so we can see which fall above or below the general mean. That county you see at the far right — you read that right — is the Yolo County, named after the Native American word “yo-loy,” meaning “place abounding in rushes,” which was a reference to the wetlands that once covered the area (in case you were wondering).
4. Apple Valley had the highest rent increase over the last three years.
Apple Valley, a town located in the Victor Valley of San Bernardino County, California, United States, has nothing to do with the company. It is approximately 90 miles northeast of Los Angeles and 140 miles north of San Diego. The average rent is $1.7K, which sounds like a steal, but it’s still up 87% over the last three years compared to $900 three years ago. Talk about inflation!
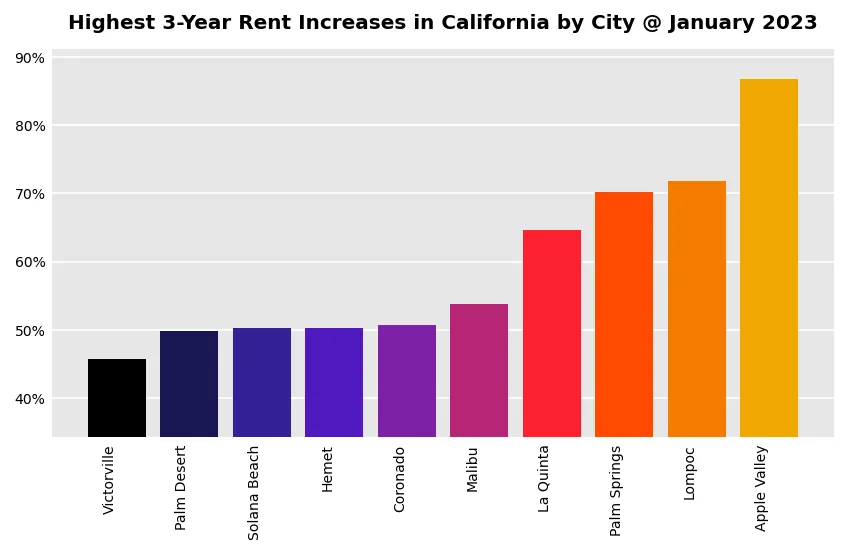 Cities in California with the highest rent inflation in three years as of January 2023
 Cities in California with the highest rent inflation in three years Dataframe
Apple Valley was incorporated on November 14, 1988, and is one of the 22 incorporated municipalities in California that use “town” in their names instead of city.
- The average year-over-year rent inflation in California is 12%
By averaging all the rents across the state and comparing them to their values from one year ago, we find that the average rent increase across the state is 12%. To put things in perspective, I plotted these numbers in a time series chart. These numbers seem to be trending down, for now. Out of the main counties in California, San Diego County seems to have the highest rent inflation as of January 2023, at ~17%.
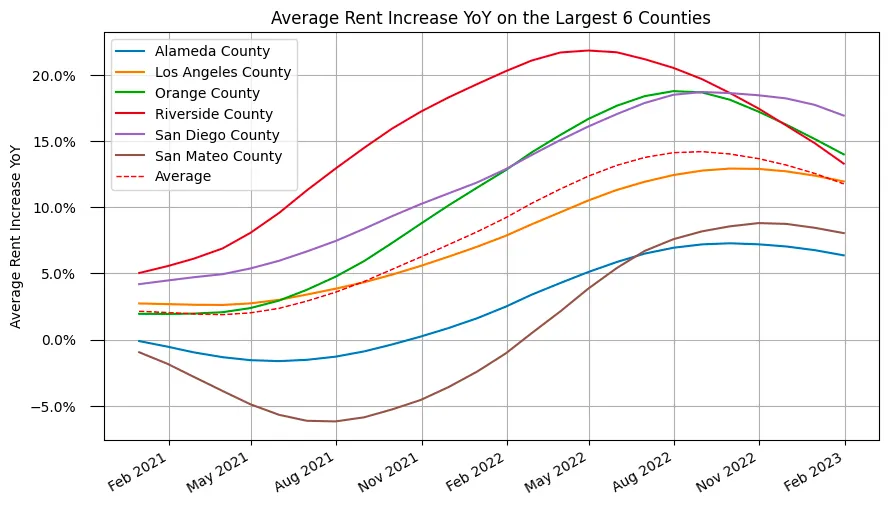 Average rent inflation in California as of January 2023
6. Rent inflation in San Diego County reached 18% in September 2022 and has since dropped to 13%
This number reflects both strong demand and well, not so sure an impact from interest rate hikes. I guess I would need to have a Mortgage Rate chart to compare. I’ll leave that for the next one. Arguably you can say they trend is showing some reversion from mid 2022 to early this year but they all seem to be in the 10–15% range.
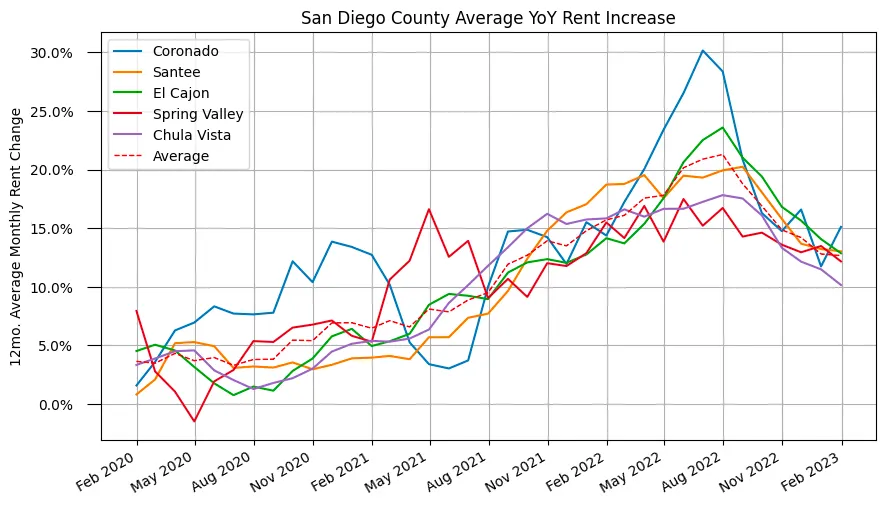 Rent inflation in San Diego County as of January 2023
The rent component is one of the largest components of the Consumer Price Index (CPI), the main measure of inflation. As rent prices increase, the overall cost of housing goes up, which, in turn, can lead to higher demand for other goods and services. This increase in demand can result in higher prices for those goods and services, again driving inflation higher. Moreover, changes in rent prices can reflect changes in the supply and demand of housing, which can be a leading indicator of economic trends.
So, are the hikes in interest rates really having an effect? Tough to say. But it seems so. Apparently only 5% of people think they will be worse in one year, compared to 13% in last year. So you could say sentiment is changing.
I am not trying to scare you, but even after the latest interest rate hikes, these >10% numbers are far from the 2% inflation target that the Fed has set to reach, someday. Got to keep in mind, the Fed has one thing to lose, and that is credibility, the one thing holding up the dollar. Hence, it seems they are pretty determined in protecting it. There’s still a ways to go before we get back to a 2–4% inflation. I just hope, as Kyla said in one of her awesome newsletters, that they use the switchbacks in the rate hike and not just try to climb it up in straight line because it does feel like we are getting to the crux, the☠️ no-fall-zone️ in this economy journey. It is really hard to understand, let alone predict, what is really going on in the economy and this may be a very simplistic view of a very complicated picture, but it holds some very recent data. While there is still strong spending and demand for goods and services, people are hurting and this may just be getting started.
Thanks for reading. I hope you enjoyed this piece. Please let me know your thoughts, drop a comment below.
Oh BTW. If you are interested in the code used for this analysis you can grab it at my github. 🤓 Clearly my main intention with these is to start creating some code repository to build upon and see where that goes. I’d recommend you clone it and give it a try.
Follow me 😉!
